Trade With Gainz


The Beginner's Guide To Stock Trading
About me:
Hey! I’m glad you’ve taken the time to visit my website! For some of you, you’ve taken your first step to becoming an independent stock trader. But before we get started, I do want to tell you a little about myself. My name is Kadeem. I was born and raised in the Bronx, NY. I was just an ordinary middle class worker that dreamed of financial freedom. All my life I was told “in order to have financial stability, you should go to school and get a good job.” I don’t think I have to tell you that in most cases, that's completely false. Even without a college degree, I landed a “good job” working for a cable company making about 60k a year and I was still struggling. Between school and credit cards, I had over 50k in debt and had no idea how I would ever make enough to pay this off. Fortunately, an opportunity arose when my job decided to become a publicly traded company and gave employees an option to invest in them. I gave my job $1,500 and within 2 days, I made $200. I was confused. How is it that I made money this quickly in my sleep?
I was so excited that I decided to download a free stock trading app called Robinhood so I could start investing. I put $1,000 into the account. I started to google which stocks I could invest in, but most of the recommended stocks were big names like Apple and Tesla. I didn’t have enough money to buy these stocks. But by a stroke of luck, a stock that cost .60c was recommended through my search. I had noticed that this stock went from .30c to .60c the day before. That’s a 100% increase in one day! I didn’t know anything about stocks, but I did know that stocks don't just double in one day. But guess what? In the penny stock world they do. (A penny stock is defined as a stock that costs $5 or less). I threw the $1,000 into this stock the next day and made $300 in less than 2 hrs. At this point, I’m thinking this is the easiest money I’ve ever made. I was too excited. I dipped into my savings account and put another 3K into my broker. The next day I went ALL IN and put over 4K into the hottest stock I saw. Needless to say, I kept throwing my money into the hottest stock I could find… but I eventually lost all my money :(
I couldn’t give up though. I found online chat rooms where stock traders would show their personal broker statements and proof that they were making money. I’ve seen broker statements that showed anywhere from $20 made in a day all the way up to 30K+ in a day. It was insane to see that some people could make half my year’s salary in ONE DAY!
It’s been about 2 and a half years since I made the decision to become a stock trader and at one point, I thought it was the worst decision I could have ever made. Despite me putting in effort to learn and study stock trading every single day, I struggled and made no money for the first 18 months. I even left social media and quit my social life entirely because I was so obsessed with learning about the stock market. The challenge was that I had no mentor, no direction and no idea what in the world I was doing. But I do know this.. I’ve never worked so hard for something ever in my life…
After struggling for so long, I’ve been able to generate a sustainable full-time income working only part-time. Now this may seem too good to be true and I understand that. Most of us personally don’t know anyone that can make a full-time income working only 10-15 hrs a week. And even if we did, would they be able to teach you or provide you with a blueprint of what you need to do to get started? This is where I come in. I’m not here to sell you anything. All the information that I’ll provide will be 100% FREE. Where I’m from, things like this just isn’t taught to us. I figured that this could be a way of giving back to the people. I would honestly feel selfish if I didn’t share this opportunity with you.
Objective:
My goal is to provide you with a blueprint of how to get started with stock trading. Whether you have a job or not, have a lot of money or not, it is possible that you too can make consistent profits as a trader. Unfortunately, at this moment in my life, I do not have the time to mentor individuals or provide hands on training, but what I will do is try my best to provide you with as much information as you’ll need in order to succeed at this. I will advise what books you should read, what videos you should watch, which broker to use (we’ll talk about this later), where to go to look up charts, what trading software I use, the strategies that you’ll need to win in the market, who to follow on social media, etc. I will also be updating this blog with more free content in the “Education” section if I feel it’ll benefit you. Remember, it took me 18 months to learn all of this on my own without any assistance. I will give you all this information upfront which should cut your learning time into a fraction of how long it took me. But even after studying my guide, you will still have to spend time researching and studying on your own.
Disclaimer:
I do not guarantee your success. Although you’ll have all the necessary information you’ll need to get started, it is up to you to study hard and consistently. This isn’t easy. In fact, 90% of all traders fail. This is because they do not take the time to learn. Note that trading is NOT gambling. Trading is NOT some get rich quick scheme. This is something that should be taken seriously and treated with respect. After all, you are investing in yourself. For the first few months, do not expect to make any money! You must take the time to learn and understand how the market works before you’ll ever make a dime. The market is a very competitive place where billions of dollars are transacted daily. Your goal is to take home a small piece of that. You will first start off with goals such as $50-$100 dollars a week, then goals like $50-$100 a day and when you’re really good, you can be looking to make over $1,000 in a day!
Transparency:
Question: How much does one need to get started?
Answer: Personally, I’ve seen people turn $500 into tens of thousands of dollars. But realistically, I think you’d need about $1,000 minimum. Remember, you won't be using this money anytime soon anyway. For the first 2-4 months, you’ll be studying and possibly paper trading (will explain what that is in the “Terminology” section).
Examples of what you can earn part-time:
I’ll be posting the following broker statements for a couple of reasons: A) It will help you believe that making good income working part-time is actually possible and B) It’ll show you that I didn’t create this blog just to bullshit you.
UstockTrade broker statement:

Tradestation broker statement:

TD Ameritrade broker statement:


-
How to Day Trade for a Living by Andrew Aziz


Videos you need to watch:
How Much Money You Can Make as a Day Trader

The following 3 links might have to be downloaded:
Warrior Trader’s Beginner Class Part 1

Warrior Trader’s Beginner Class Part 2
Warrior Trader’s Beginner Class Part 3
How to Read Charts
The Ultimate Candlestick Patterns Trading Course
Stock Market Crashes, Recessions, Trading Gold, VXX, & the Spy
4 Day Trading Strategies for Beginners (How to Trade Stocks)
Trade Like a Casino for Consistent Profits by Adam Khoo

Trade Like a Casino Part 2: Creating a Profitable Stock Trading System

How To Day Trade Using Volume
How to Day Trade Breakouts
How to Trade Breakouts
How to Read Japanese Candlestick Charts
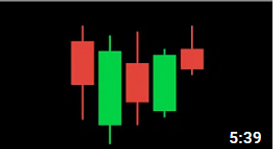
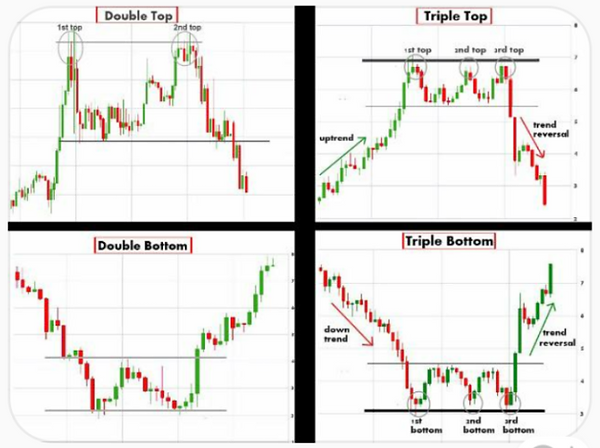
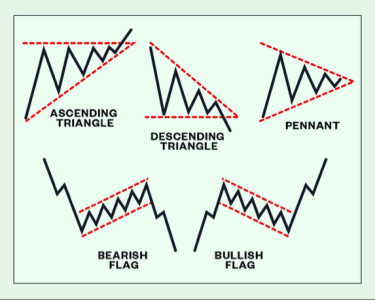
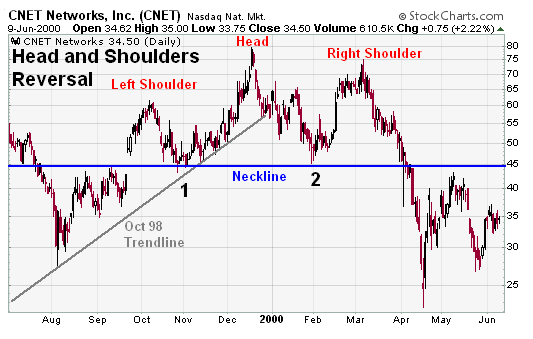
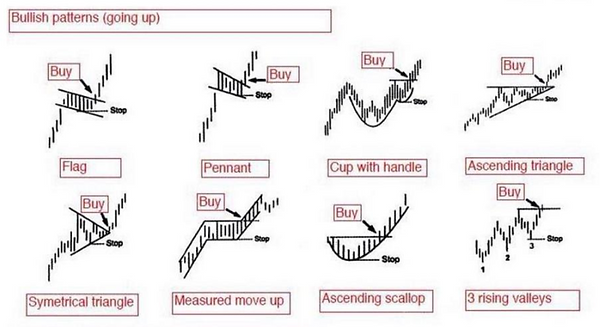
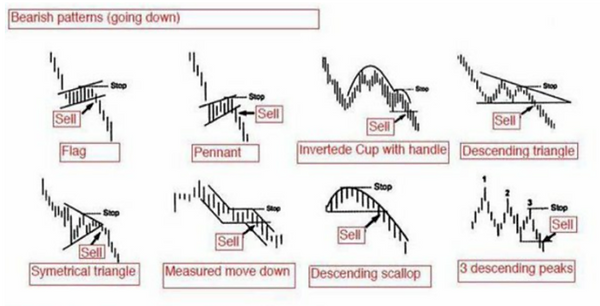
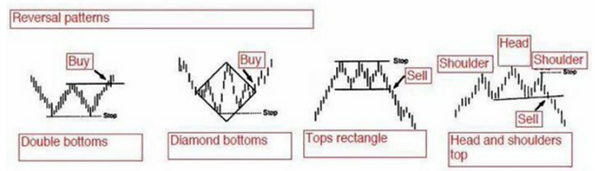
Chart Patterns:
More videos:
More advanced videos will be posted below, but you will only benefit from them if you’ve already read the books and watched all the videos above. These videos advanced my trading skills to the next level. If you're a full time worker and have no time to look at charts throughout the day, skip this entire section for now and move on to the "Stock Market Hours" section. Just below that will discuss swing trading which should be more fitting for your lifestyle. If you’re day trading, these following videos will teach you exactly where to enter a trade. These strategies are proven to work, as they’ve worked for me countless times. Please take notes!
Inflection Point Training Part 1:

Inflection Point Training Part 2:
More free content from their site:

If you want to view more video content from GreatStockPix, you can visit their site. There are certain disclaimers that prevent me from sharing them here:
https://gsp-dtw-training.vids.io/tags/bd9dd2b9191a30/free-webinars
Inflection points / Entry Examples that I took:
Ticker: VSTM
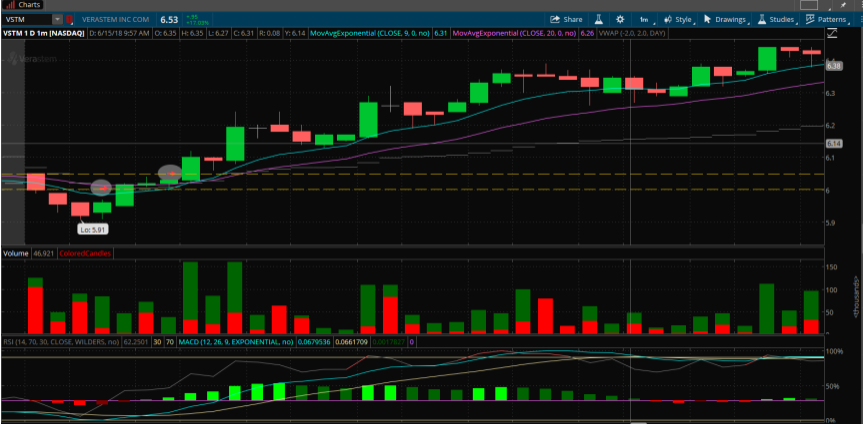
On this 1 minute chart, the circles surrounding the arrows represent entry points that instantly placed me green. The 1st entry is a whole number break at $6 and the second entry was a red to green move at $6.05. These types of entries have an extremely high success rate.
Imagine buying 500 shares at $6.00 and selling them at $6.20 five minutes later. You’ve just made $100 in 5 minutes!
Ticker: NVAX
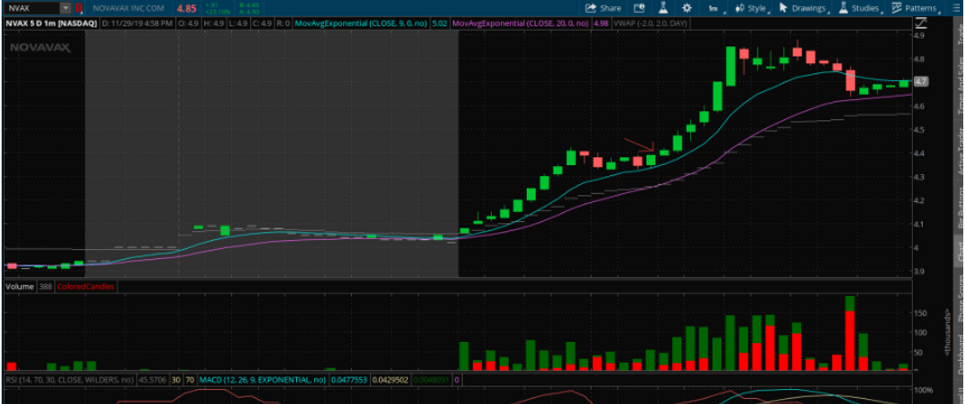
This is an example of when you miss the 1st move, but have to wait for a pull back or consolidation (sideways movement) to plan your entry. This $4.40 break entry was good. Knowing that the stock is now breaking out of consolidation after a good upward movement and that the half dollar is right above ($4.50), we can figure that another big move is coming if the half dollar breaks too. Imagine buying 1K shares at $4.40 and selling them at $4.60 four minutes later… You’ve just made $200 in 4 minutes!
Ticker: NIO
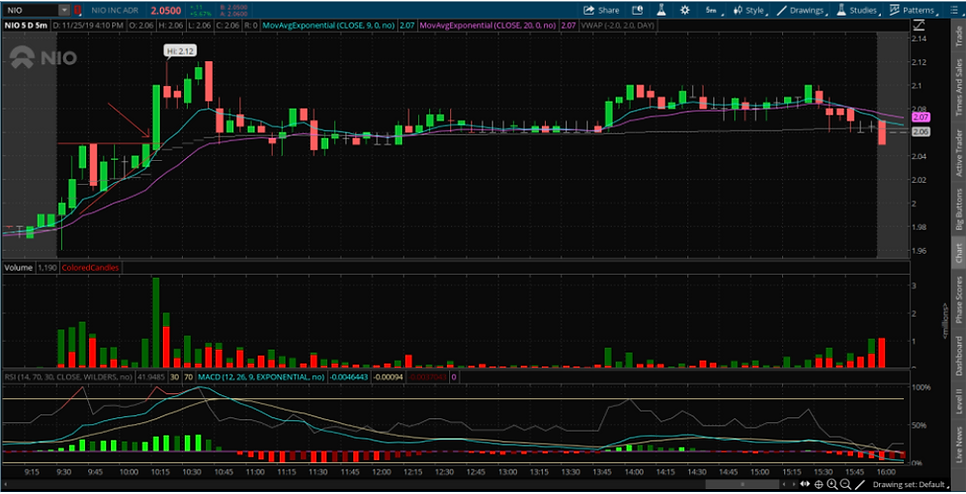
By now, you should recognize this pattern… It’s the ascending triangle pattern. In my opinion, this pattern has the highest success rate when a stock breaks out of it. Here you would buy the stock as the stock is breaking out of the pattern. Your entry would be $2.05 or $2.06 and selling some into the pop for profit and selling the rest if the stock comes back down to your entry (which in this case it did). But imagine buying 1K shares at $2.05 and selling them at $2.10 a minute later. $50 in 1 minute? Not too bad.
Ticker: SRNE
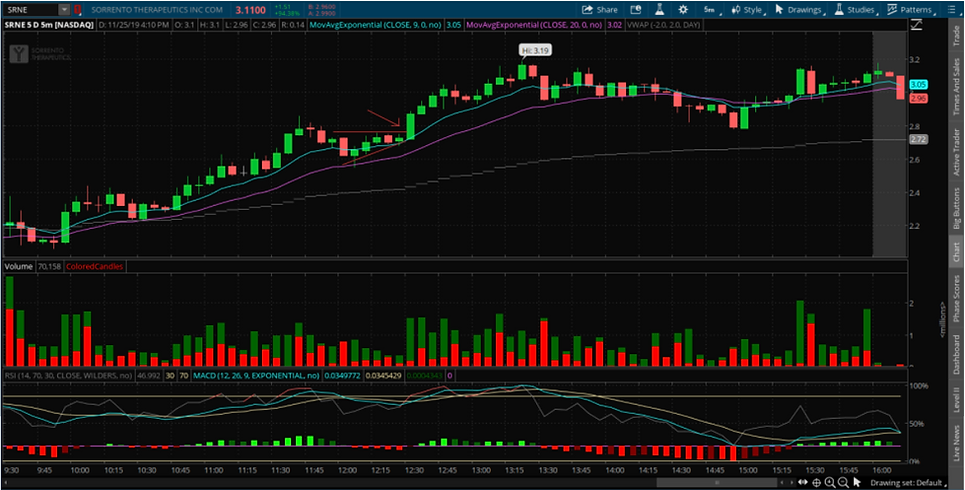
Now this chart is far more complicated, but after you watch charts long enough, you’ll begin to see these patterns forming and know exactly where to take your entry. Here, there was a big seller at $2.75 (notice… a quarter number). A big seller + pattern = high success rate. If you were to buy 2K shares at $2.75 and sold it for 25 cents at $3, you would have made $500 in 4 minutes.
Ticker: ZYXI
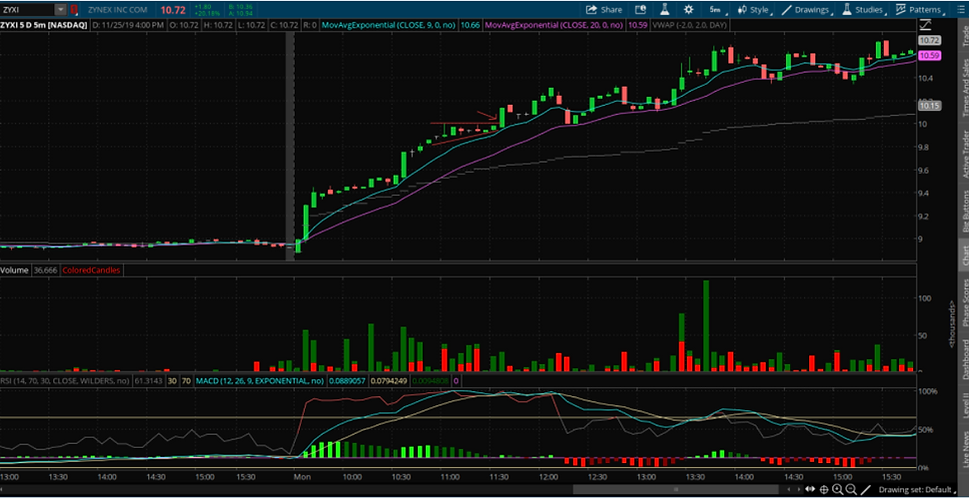
This is another example of missing the 1st pop, but waiting for a pull back or consolidation. Here the stock consolidated right under 10 dollars. We can call this pattern forming an ascending triangle or a “flat top breakout”. Can you see what happened when it broke 10 dollars?
Now let’s show you a play by play example:
Ticker: ADXS
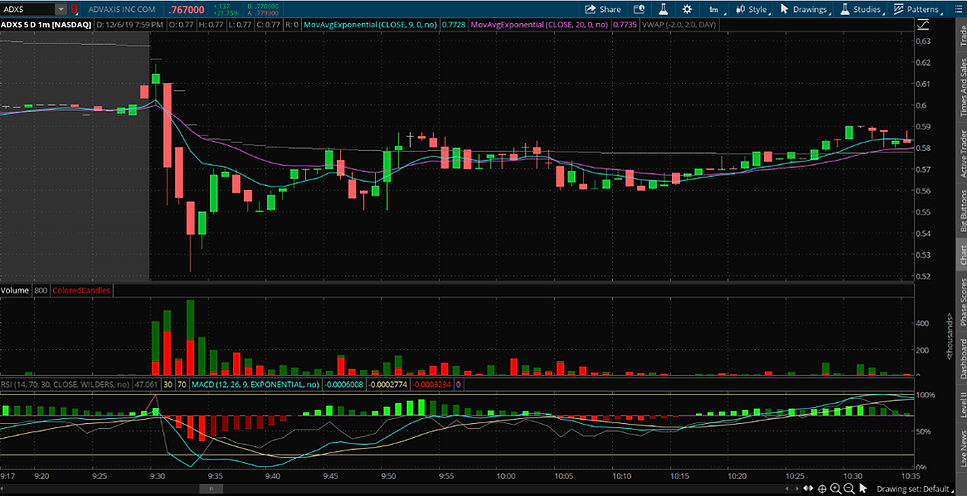
It’s 10:30am and you’ve just spotted this stock ADXS. You see that it opened around 60 cents, dumped, but recovered a little and started moving sideways (consolidation). The high of day is .62 cents and it’s slowly creeping back to 60 cents.
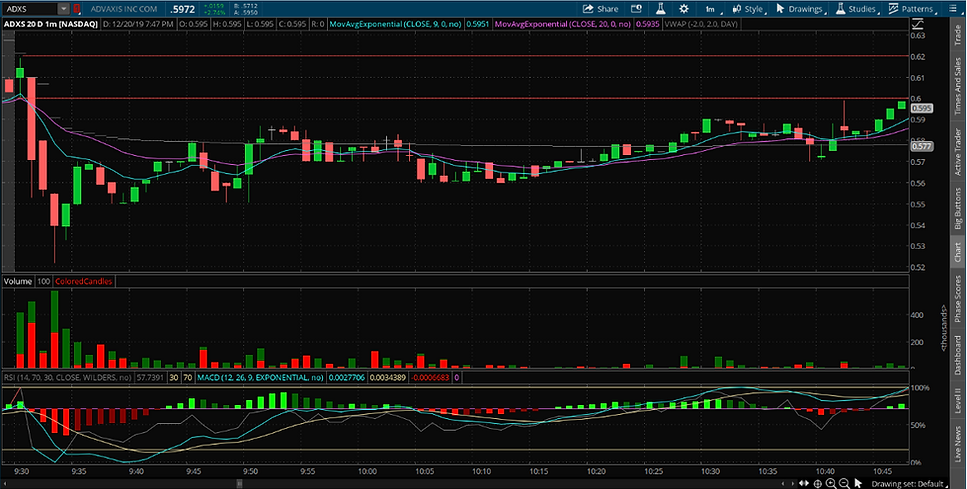
It’s now 10:46am and you noticed that there’s a big seller at 60 cents. If the stock breaks .60, then .62, it would have now performed a red to green move (another high success rate move). What do you do if .60c is breaking? Take the trade!
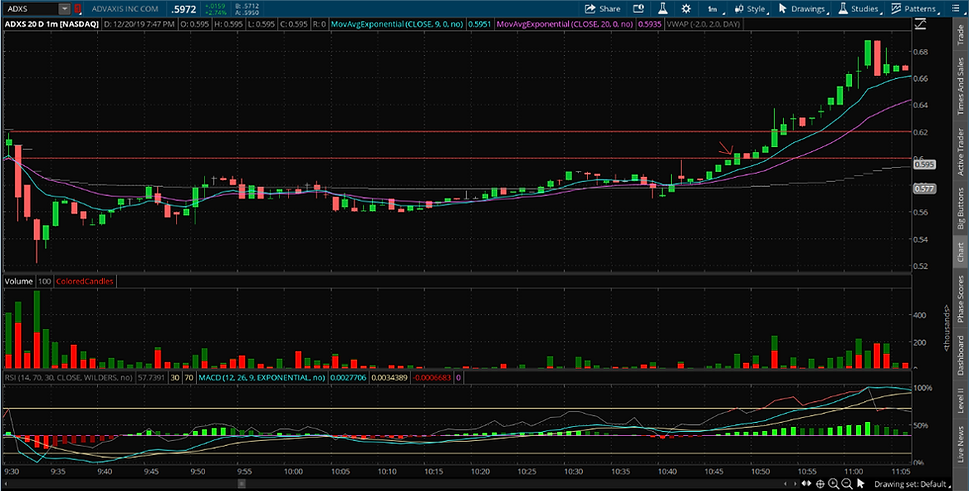
If you took 2K shares at .60 and sold at .65, you’ve just made 100 dollars in 12 minutes. What if you took 10K shares? What about 20K shares? That would have been some serious gainz!
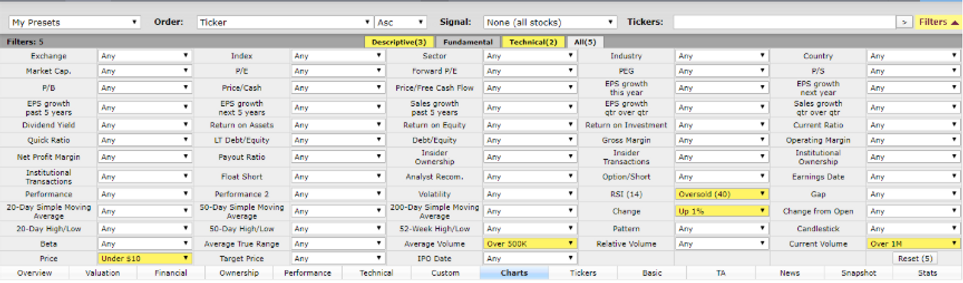
Price: Under $10. You can toggle with this at anytime if you’d like up to $30.
Average Volume: Over 500K
Current Volume: Over 1M
Change: We want to catch stocks as they’re moving up. Placing a change of 1%+ would help. You should switch this number to a negative number sometimes if you want to find stocks that are oversold, but are still going lower. You’d want to watch them daily for a possible bounce.
RSI: Place this at 40. You can do additional research on what RSI is, but the RSI numbers will tell you whether or not a stock is oversold. Here’s a video that should help you understand:
Let’s look at a couple of examples of swing-trade worthy stocks. You’ve just went on Finviz, set the parameters and a stock chart for CEI came up for you. You looked at the chart, then you searched the ticker (stock) in your broker to get a better look. This is what you see:
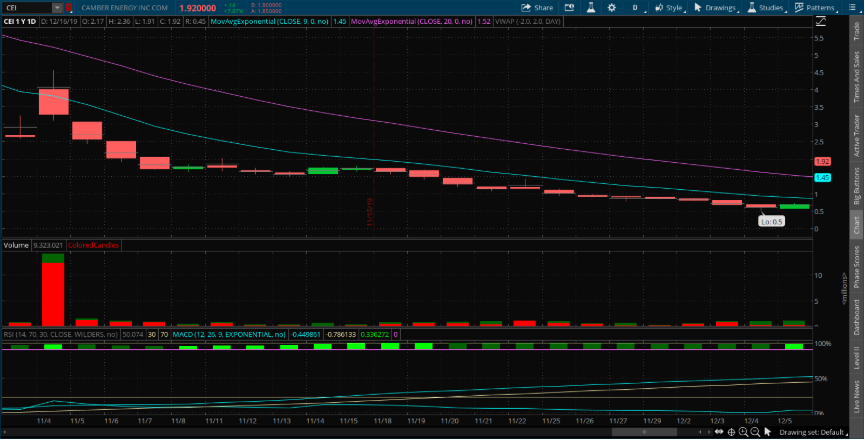
Looking at the daily chart, we know that this stock has been on a decline for a while. Within a month or so, the stock dropped from $4 to .50 cents without a decent bounce! This is a prime candidate. After so many red days, finally the last candle shows green. This is where we take our entry with a stop loss under support. Ideally, you want to buy as close to any support level as possible. Or if you saw this chart after the market closed, then you want to get in the next day if it makes a red to green move or drops to support. Look what happened 3 days later:
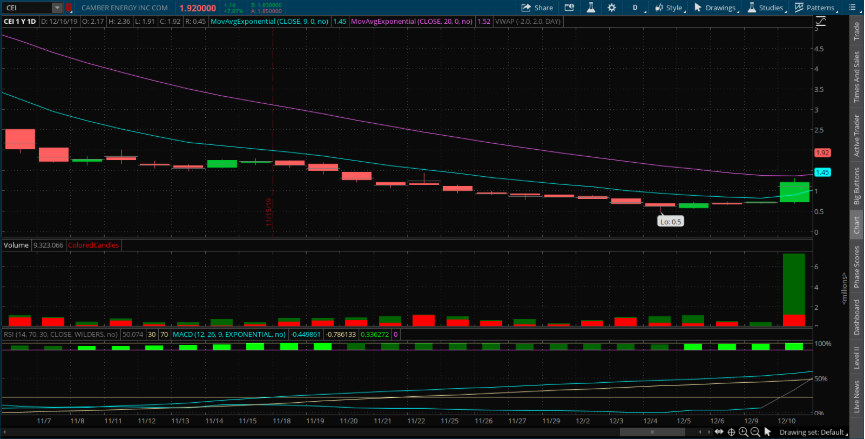
The stock went above $1. That’s over 100% increase from the lowest support level of .50 cents! You could have potentially doubled whatever money you bought in with. Even if you didn't sell for 100% increase, but 20% instead, that’s still a great trade!
This chart isn’t as easy to understand, but we can see that recently the stock was above .50c and now it’s moving sideways for over a month and currently sitting in the .20s. That’s over a 50% drop. It’s oversold. The last candle closed around 20 cents but had unusually higher volume than its previous days (the vertical bar under each candle represents the volume). Look at what happened the next day:
The next day, the stock went to .24c before retracing back to around .23c. That’s about a 20% move the stock made from .20c. Your goal is not to always sell at the top, but to sell for a decent profit. A 5%-10% profit is still great for a 1 day swing.
Moving averages:
Before discussing the additional technicals you will need for swing trading, it's important that you watch this video explaining what moving averages are:
How to Trade Moving Averages (Part 1)
How to Trade Moving Averages (Part 2)
When To Enter Swing Trades (Profitably!)

Use THIS Time Frame When Swing Trading
RSI Trading: Most Powerful Way To Trade With RSI Indicator
What are Trailing Stops and How to Trade with Them (Great for swing traders!)
Additional video for all traders:
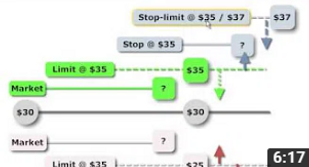
Order Types (market, limit, stop, stop-limit)
Level 2 + Time and Sales:
Level 2 is an indicator that shows you buyers and sellers. This is the most important tool you must have as a day trader, but even as a swing trader, you should understand it as well.
Time and Sales is an indicator that shows you the amount of shares being either bought or sold in real time on the stock you’re watching. This goes hand in hand with Level 2 and is a must have for day traders. Swing traders should have a basic understanding as well, but it's not as important to know. The following video will discuss both:
How to Read Level 2 Quotes for Day Trading:
PDT Rule:
This is a very important rule you must understand before day trading. This rule will not apply to swing traders and you will see why (all traders must watch):
Understanding the Pattern Day Trader Rule
Who to follow on social media:
The greatest thing about people who trade stocks is that everyone wants to be a guru. Everyone wants to be the guy calling the shots and having people follow them and their plays. Well guess what? NOT ME. All I do is copy in silence what these “gurus” are doing and make money off their calls. You should do the same! Their determination for clout will be your gain because they’re constantly posting watchlists, constantly posting content that you can copy, and constantly posting charts you can study. But I’m going to be honest with you… Most of the “gurus” you’ll come across on social media are “pumpers”. A pumper is someone who has enough people following them that they secretly buy into a stock before calling the play to their followers. Their followers buy in causing the price to rise, then the “guru” sells at a higher price. Most of them are scam artists and they destroy new traders with this technique. But after 2+ years of trading, I am convinced that the following people I will recommend are in fact the real deal. Study their watchlists and study their calls.
1) Greatstockpix or GSP - Greatstockpix is a company run by two older professional traders. They’re the no bs type of traders that are highly disciplined in what they trade and what they teach. You’ve already seen videos by them posted earlier in this blog. You can follow them on Twitter, Youtube and/or on Stocktwits (a knock off twitter, but just for stocks). GSP posts watchlists every evening before the next trading day. I suggest watching his youtube videos of the watchlists explaining why its on his list.
2) Super1nyc - This is a disciplined educator that posts daily pre-market movers (which is important to see if you do not have a pre-market scanner like myself). I haven’t seen any videos by him, but the pre-market watchlists that he posts are a great tool to have for yourself. You can follow him on twitter or stocktwits.
3) Platinum_Trades - This is a swing trader that specifically looks for oversold stocks with great set ups. I trust most of his calls and I suggest following him and studying his calls as well. You can follow him on Stocktwits.
4) Ospreyeye - Ospreyeye is a trader you can also follow on stocktwits that posts charts that are great for studying.
If you decide to follow anyone else on social media, just be careful. If you follow the wrong person and take the wrong advice, it can destroy your trading career. A lot of the people you see on social media are just frauds or pumpers. You will eventually learn the market well enough to be able to figure out who is legit or not.
Let’s talk chat rooms:
There are literally 100s of trading chat rooms out there, both free and that you can join at a cost. Being in a room where there are dozens of people watching the market for plays and discussing them will give you an obvious advantage over just trading by yourself. I have a love/hate relationship with chat rooms and here’s why… Remember how I said that 90% of traders fail? Well just because you’re in a chat room doesn’t mean that their members are excluded from this statistic. Whether you join a free chat room (recommended) or one that you paid for, just know that most of the plays they call in the room will be trash! They may be convinced the play they’re calling is actually good, but in reality, it’s not. This is because most of them are still learning. They do not know any better. The real problem happens when a noob takes advice from another noob. It’s a recipe for a disaster. It’s going to be your job to recognize which plays are good vs which plays are bad. Through your continuous training and studying, you’ll be able to filter through all of the calls and pick which one is best for you. When I’m in a chatroom, out of 20 calls, I would probably only pay attention to 2 or 3.
How you should prepare for the market the night before:
The night before the market opens is very important. Every successful trader studies or researches stocks the night before. I’ve made it simple for you. I’m going to lay out the foundation of what your night should look like:
1) Go on Finviz.com and screen stocks using the parameters I suggested. Not only are these good for swing trades, but it will sometimes provide day trade-worthy stocks as well.
2) Go on youtube and watch GreatStockPix’s video and find out what he’s watching for the next day and why. If you’re day trading, this is a must.
3) If you’re on stocktwits or in a chatroom, find out what these guys are watching. If you’re swing trading, Platinum_Trades on stocktwits usually has good content.
4) Go online, research and study additional free content. Keep studying more information outside of what I’ve shown you in this blog. It can be anything. The more you learn, the more you will earn.
How you should prepare for the market the morning of:
The morning of the market is also important because additional stocks that are not on your watchlist will appear on pre-market scanners. Here’s what your mornings should look like:
1) Look over your watchlist. Check to see if any of your stocks are moving pre-market. Stocks moving pre-market (before 9:30am) are a good indicator that there will be volume after the bell rings (after 9:30am).
2) Go on stocktwits and look up “TradingKingEric”. He usually posts pre-market movers from his scanners around 8:30am. These are stocks that are already up a good % and have volume.
3) Look up “Super1nyc” on stocktwits. He will also post pre-market movers usually around 9:00 am.
4) If you’re in a chat room, see what they’re watching. They will usually be watching the same stocks you’ve seen on pre-market scanners.
Trader’s checklist:
In order to be a successful trader, these are the tools you will need:
1) A fast laptop or desktop
2) A charting software - Download Thinkorswim’s trading platform for charting. You need to open an account with TD Ameritrade to do this, but you are not required to put money in. You can let your sales or customer service rep know that you wish to open an account and practice before putting real money in. You can “practice” indefinitely.
3) Chat room (optional)
4) A strategy - Refer to the inflection point videos by GSP for the day trading strategy. Refer to the “Swing Trade” section for the swing trading strategy.
5) Discipline - Remain 100% disciplined in your studies and future trading.
Terminology / acronyms that you should be familiar with:
AH - After Hours - After the market closes.
Bag holding - Holding shares of decreasing value in the hope that they will rebound or reverse downward trend
Beat - A stock has beaten earnings report expectations
Candle/Candlestick Chart - A box and whisker graph in which each box and whisker or "candle" represents one day of trading activity on a given stock.
Catalyst - An event that causes the price of a security to move, sometimes significantly. Examples of stock catalysts are: Company earnings releases, Investor/Analyst Day, analyst revisions, news or a press release.
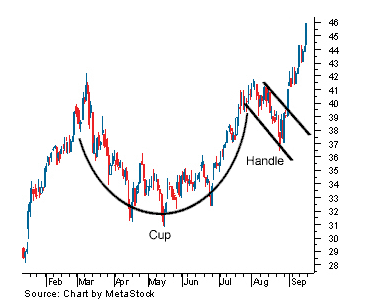
C&H - Cup and handle formation. Look up chart patterns for more
Channeling - When a stock continues to fluctuate through a particular set of price ranges on a fairly consistent basis. This is good for determining when to buy into a stock and when to sell and can be for a scalp play.
Dead Cat Bounce - A temporary recovery in share prices after a substantial fall
DD - Due Diligence (basically research and evaluation)
EMA - Exponential Moving Average - A type of moving average indicator frequently used in technical analysis
EOD - End of day
EPS - Earning per share
Float - The number of shares actually available for trading to the public.
FOMO - Fear Of Missing Out
Former Runner – A specific ticker has moved a huge amount very quickly at some point in its life, showing the possibility for it to happen again.
Front Loading - Slowly loading a bunch of shares in a specific stock and then 'pumping' it.
Halt - Trading has been paused by the market.
HOD - High of Day
Idea - A trade idea. Example: "ISIG idea 2.11" means that the person who posted this feels that the stock has a good entry over $2.11. The reason for "over 2.11" is because there may be resistance until that point. Ultimately you must decide for yourself whether or not to enter the trade as these are only speculations.
IPO - 'Initial Public Offering' - is the first time that the stock of a private company is offered to the public.
Knife Catch - To buy into a stock that is currently experiencing a drastic fall in price near the lowest price before it begins to rebound. From the phrase: “One should not try to catch a falling knife.” This is not something a beginning trader should try. Much like trying to catch an actual falling knife, it can be very risky, but with practice and familiarity with the history of a ticker a successful knife catch can be executed.
LOD - Low of Day
LL - Limited Liquidity - Limited number of shares available for trading by a brokerage (it's difficult to buy into a stock that is LL)
Loading - Buying more shares of a stock that you already own
Low Float - Relatively small number of shares available for trading. Tend to be more volatile, meaning they move quickly
Mental/Mental Stop Loss - A non-literal stop loss that you place in your mind at which point you are determined to sell your shares of a stock. The point of doing this is to avoid having a literal stop loss triggered in the event of a sudden drop below support.
MM - Market Maker - A person that is capable of moving the price of a stock by buying or selling a huge amount of shares.
NHOD - New High of Day
Offering - The issue or sale of a security by a company
Overnight - Just as it sounds, holding shares overnight
PDT - Pattern Day Trader
PM - Pre-Market - Before the market opens.
POS - Piece of shit - usually referring to the stock as “junk”
PR - Press Release (news)
Paper Trading - Using a simulation through your broker where you would trade with fake money as practice. OR literally writing your entries and exits on paper as practice while watching a stock move.
Print - The complete execution of a trade. Example: "1.74 Print" means that the given ticker had an order purchase for 1.74 and it was completed.
Psych - Psychological level (round numbers like $1, $1.50, $2)
PT - Price target
Pump/Pumper/Pump&Dump - Artificially inflating the price of an owned stock through false and misleading positive statements, in order to sell the cheaply purchased stock at a higher price.
R/G - Red to green move
RH - Robinhood app (trading platform)
R/R - Risk to Reward ratio
R/S - 'Reverse Split' - A reduction in the number of a company's traded shares (float) that results in an increase in the par value or earnings per share.
Run/runner - A stock that drastically gains in value over a short period of time
Scale/Scale out - To sell a portion of your shares.
Scanner – This scans for stocks within any given criteria.
Short Float - The ratio of tradable shares being shorted to shares in the market.
Spread - The difference between the bid and the ask price on a stock.
SMA - Simple Moving Average - A type of moving average indicator frequently used in technical analysis
Squeeze - When short sellers are forced to buy back their shares due to increased buying pressure
Sympathy - When a stock gains value due to another stock that is associated with it also gaining value. Sympathy can be from being in similar sectors, having very similar equity curves, being based out of the same country, similar legal effects of new laws/restrictions/regulations, etc.
Thin - Not many shares traded
Tutes - Institutional investors
UST - UStockTrade (trading platform)
VWAP - Volume Weighted Average Price - Calculated by taking the price multiplied by the number of shares traded then divided by the total shares traded for the day. This is an indicator used in technical analysis
WL - Watch list
WW - Worth Watching
You will understand these brokers a little bit more in my “Broker” section later in the blog. And yes, it is possible to make a 6 figure income working only part-time. You may not believe it right now, but it’s been done countless times by traders in the market. As I stated earlier, this is not easy. If it were, everyone would be doing it. If you’re not willing to invest months of your time studying before making money in the market, then please do not waste your time on this website. Time is valuable and the last thing that I want is someone wasting their time approaching this in a casual way and expecting to make consistent money. However, I promise that if you put tremendous time and energy into learning how the market works and how to trade, you too can take advantage of this and transform your financial life.
Note: The standard market hours are from 9:30 am - 4:00 pm, Monday - Friday. If you have a 9-5 job working all week, it may be a little more difficult to study market movement, but not impossible. There are plenty of full-time workers that do transactions from their cell phones here and there and are still able to earn income through "swing trading" (will discuss what that is later).
Now if you're willing to take the next step in investing in yourself, let's move on to what's most important...
Education:
-
Disclaimer: Besides the books I’ll recommend, the following content that you’re about to receive is absolutely free material that is already online. I do not intend to make money from sharing this material. I am not affiliated with any of the creators of this content. This is for educational purposes only. Some of the creators of this content will attempt to sell you something by self-promoting their success. I will not recommend against what they’re selling, however I will recommend who I believe will benefit you most. Just know that personally, I’ve never purchased anything from these content creators.
Books you need to read:
-
Rich Dad Poor Dad by Robert Kiyosaki
-
Japanese Candlestick Charting Techniques, Second Edition 2nd Edition by Steve Nison
How I learned To Day Trade In A Week
Stock market hours:
The market is open from 9:30 am - 4:00 pm, Monday - Friday. However, pre-market is open from 4:00 am - 9:30 am and after-market hours are from 4:00 pm - 8:00 pm.
Personally, I rarely trade pre-market or after-market due to lack of liquidity/volume.
There are 2 types of trading styles you can choose:
1) Day trading - Buying and selling a stock within the same day.
-
Day trading is for people that have time in the morning. Day trading has the highest form of risk, but yields the highest rewards. The inflection point strategy that I use is strictly for day trading
2) Swing trading - Buying a stock, but selling it a day, days or weeks later.
-
Swing trading is for people who have full time jobs and/or have no time in the morning/throughout the day to stare at charts and execute moves. Swing trading is perfect for beginners especially because it’s a lower risk and still yields good results.
Swing trading:
Because most of the material provided so far has been geared towards day trading, let’s discuss how you can be successful as a swing trader as well. Now keep in mind, I am not a swing trader, however, I do know a few people who are successful at it and they’ve helped me compose this section of my blog.
The first thing you want to do as a swing trader is to look for stocks that are good for holding multiple days based off their daily chart patterns, volume and other indicators. Here’s what you’ll be looking for:
-
Oversold stocks - Stocks that have been sold so much and so quickly that the chances of it going much lower isn’t as likely as it is to go up.
-
Liquidity - This means the stock has enough volume that you’re able to get in at the price you want and get out at the price you want on any day.
-
Continuation - Some stocks have been oversold and have been moving sideways for so long that it’ll start to curl upward. This curl is what we call a “breakout”. Sometimes we look for stocks that broke out of its oversold state and we hope for a continuation for the next day or two.
Question: How do we find these stocks?
Answer: There are multiple ways of searching for these stocks, but one way that helped me the most early on is through a website called Finviz.com. It’s a free website for screening stocks. You can pick and choose different parameters that you wish to see, and the website will populate charts that meet them. I will show you a screenshot of the Finviz site with the parameters for swinging stocks. All you have to do is copy it.
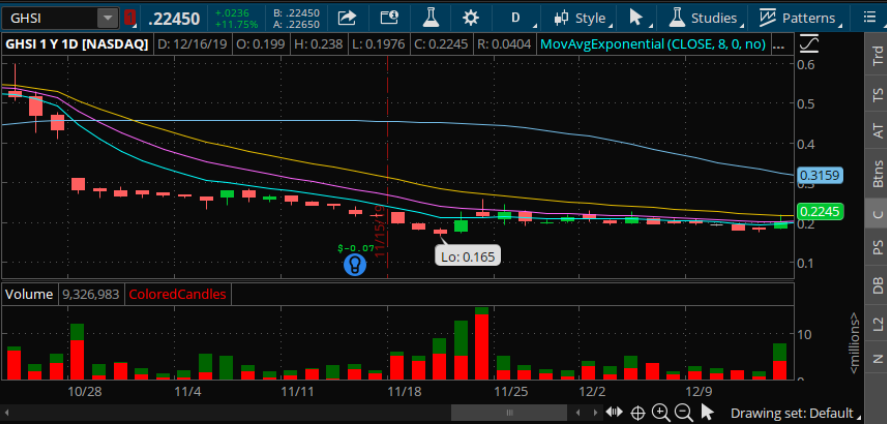
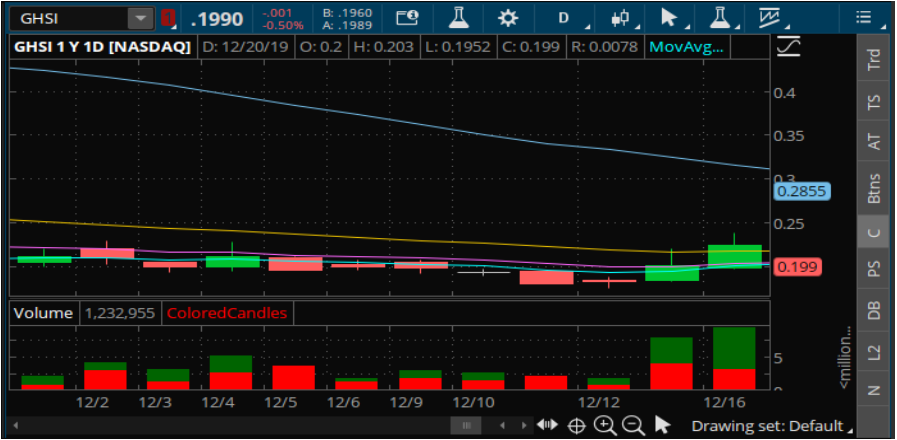
Here’s another example. You checked Finviz and this stock chart of GHSI came up:
Moving averages are extremely important, especially with swing trading. On a daily chart, you want to have these 3 moving averages: 8, 13 and 21 EMA
Take a look back at the GHSI chart before it broke out. You can see not only was the set up good, but it also crossed and closed above the 8 and the 13 ema. This usually indicates that an upward move is coming in the next couple of days. Know that there are traders that repeatedly scan the market for these types of stocks (stocks crossing through emas), so this usually brings buyers in. Also, if you ever see a chart where the 8 ema is crossing the 13 in an upward direction + still under the 21ema (like GHSI was), it’s usually accurate. If the stock closes above all 3 emas with volume (crossing over all 3 in the same day), it’s still a good sign there will be a continuation.
There are countless examples of these types of set ups where the emas are crossed, but because they happen in real time, I wouldn’t be able to post all of them here. It is up to you to continue to screen the market, find these charts with the guidance I’ve given you and study them.
Helpful videos on swing trading:
How To Make $100 A Day Swing Trading
Simply put, the stock market is geared toward people who have money. Your ultimate goal is to grow your account to over 25K if you want to bring in serious money. However, there are some brokers that you can use that do NOT have a PDT rule. We will discuss my broker recommendations below:
Brokers:
A broker is an application that you will use either on your phone or computer that will allow you to purchase and sell stocks. You may also use your broker to view/study charts. Here are some brokers that beginners can choose from:
1) Robinhood - This is one of the most basic brokers out there. It’s perfect for beginners to get their feet wet in the game understanding how to maneuver through buying and selling. My recommendation is that you start off with this one to get a basic understanding of the fundamentals. You can put 20 dollars in there to play around with when you’re ready to start executing plays. All moves are 100% free with this broker. They also offer extended hours from 9:00am - 6:00pm
2) Ustocktrade - This broker does not have a PDT rule, however there is a $1 monthly subscription fee and a $1 commission fee per buy and sell you execute. This is a broker to use when you’re ready to start day trading. This will allow you to make countless moves throughout the day. The downside to having this broker is that executions are sometimes slow and sometimes they only have a limited amount of shares to buy, especially if it’s a penny stock. Even with these downsides, you can grow your account over 25K using this broker before moving onto better ones. Their trading hours are from 9:30am - 4pm.
3) Tradestation - This by far is the fastest broker I’ve ever used. I’ve had no complaints with them. However, there is a $5 commission fee per buy and sell so this broker isn’t good for brand new traders. Trading hours: 8am - 8pm.
4) Webull - Webull is another basic broker, but great for beginners. Webull offers 100% free trading with trading hours of 4:00am - 8:00pm. They offer a T+1 cash account option. What this means is that you can trade with the cash you have and it will take only 1 day for the funds to “settle”. This means in 1 day you’ll be able to use your money again. This is much better than being restricted by the PDT rule.
5) TD Ameritrade - This is the only broker I use. TD Ameritrade has gone 100% commission free and their executions are relatively quick. It also comes with the best charting platform I’ve ever seen called Thinkorswim. This is where you should study all of your charts. Trading hours: 8am-8pm.
Your charting platform:
The best charting platform out there that I know of is thinkorswim. This is the platform you should be using to look at charts. It’s 100% free and comes with your subscription to TD Ameritrade. For adding technicals like moving averages, switching between time frames, and setting up your charts to be as user friendly as possible, you have to reach out to TD directly: 1-800-751-9000. They’re open 24 hrs and their customer service is really good. You can also youtube videos on how to set up indicators and use this platform. Here is an example:
How To Use TD Ameritrade's ThinkorSwim | For Beginners: